We're all trying to shoot the smallest groups, tiny little targets at increasingly long ranges, or being absolutely certain we're ethically putting an animal on the ground with every trigger pull. What's it all got in common? There is always some amount of random chance involved. What's the muzzle velocity of the next shot? Where will it fall in that group on target? We never really truly know. By using statistics, we can start to predict hit probabilities, determine if data is truly different, or show people the true capabilities of their rifle (it's probably not as good as they think).

This doesn’t need to be a statistics masterclass. Understanding the difference between a sample and a population, knowing the basics about normal distributions, and connecting the Central Limit Theorem to the reloading room can shine more light on the subject of consistency as it pertains to rifles. We'll try to keep it as brief and informative as possible.
An Elementary Look at Statistics
Statistics is a mathematical discipline that deals with the collection, organization, analysis, interpretation, and presentation of data. When a rifleman is chronographing muzzle velocity or truing their ballistics solver, they’re collecting data on their rifle system as a whole; ammo, rifle, optic, shooter, it all comes into play. As they head home and try to make sense of what they saw at the range, they’re subconsciously organizing and analyzing that data. The natural progression is to interpret that data and use it to make a decision.
“Should I reset my zero down 0.2 mils?”
“I think my average muzzle velocity is 2975 fps at 95 degrees.”
“I was low on those 952 yard targets, so I should probably drop my BC to match it.”
Whether they realize it or not, they’re going through this process (or should be if they aren’t). Why not take it a little further and get a little more benefit from it?
Let’s take a look at some basic statistics and see how it plays into reloading and shooting.
Sample vs Population
The definition of a statistical population is that it is a set of similar items or events which is of interest for some question or experiment. Because populations can be theoretically infinite, this could be seen as all the rounds fired from your rifle action over its lifetime, but since barrels wear out faster than actions—that adds more variables that would affect the population—for practical intents and purposes, the statistical population should be considered the life of the barrel. That’s what we’re concerned about, after all, predicting what a bullet will do upon leaving the current barrel. We expect to have to change things and gather new data for a new barrel.
Statistical samples are a subset of a population that are used to estimate characteristics about the whole population. That five round group you fired was a sample of the population, probably taken to try to ascertain the precision of the rifle. The 10 shot string over the chronograph was a sample to try to obtain your average muzzle velocity.
It is a fundamental understanding of statistics that when you take a larger sample of the population, there is a much better chance of you estimating correctly about the behavior of the population. If you ate one bite of a casserole, you may have some idea about how that casserole tastes, but there could be surprises. There could be another whole ingredient and you wouldn't know without continuing to eat! If you ate half the casserole, you would have a much better idea what the other half will taste like. This is how increasing the sample size works. More data gives more certainty.
Normal Distributions
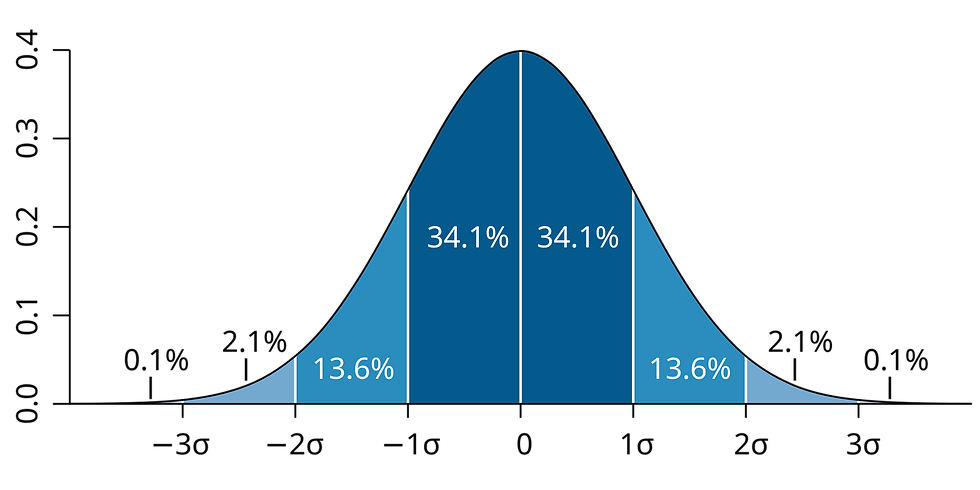
Normal Distributions, also known as Gaussian Distributions, are a type of probability distribution for variables that have real values and are random (Figure 1). They are typically characterized by a bell curve, but more specifically the standard normal distribution is a bell curve that has a mean (average) of 0 and a variance of 1 (μ = 0, σ² = 1). All normal distributions are variants of the standard normal, just with their mean in a different location and/or greater or lesser variance.
What this means for us as reloaders is that the average value of our ammunition’s velocity falls in the center of the bell curve. As long as the reloading process is consistent, we’d expect that ±1 SD from the mean is where about 68% of the velocities would fall, ±2 SD would encompass about 95% of the velocities, and ±3 SD would encompass 99.7% of the velocities. You can extend this out as far as you want, but past ±3 SD’s, you start playing with very small probabilities. The probability that a data point falls outside 4 Standard Deviations from the mean is about 0.006%, or 1 in 15787, for example.
The power of this is that once a good measure of the rifle’s average velocity and the standard deviation is had, you can effectively know the realistic limits of that load's expected velocity. This is part of the basis for a lot of hunters to start determining their effective range on game: "Can I put the bullet where it needs to go with certainty?"
Central Limit Theorem
How do we know that reloading falls under a normal distribution though? Besides decades of empirical testing, the Central Limit Theorem. Just to briefly touch on it, the Central Limit Theorem states that the sum of many random variables will have an approximately normal distribution. That is powder weight, case capacity, case hardness, seating depth, etc. Every variable that we try to control in the reloading room still has some amount of randomness to it, and especially variables outside of our control (primer brisance, case body and bullet hardness, powder kernel size, etc.). We operate in an environment of randomness, and because of the Central Limit Theorem, from that randomness we can pull some amount of order.
Statistics and Dispersion
In addition to velocity, it’s been shown that dispersion is a normal distribution as well. There’s no big secret to making a precise rifle: have a gunsmith cut a good chamber on a good barrel, put good components into reloads, make sure the powder and charge weight matches the cartridge, bullet and barrel length, and make the rifle heavy. If anyone follows these steps, it’s not likely that they find that the rifle shoots badly.
Regardless of a rifle’s inherent precision, the dispersion pattern is still found to be normally distributed when variables are kept consistent. More simply, you can imagine that every rifle has a cone extending from the muzzle and every bullet you fire has a path that it will travel inside that cone.
Cones of fire are more typically a part of the conversation for machine guns where danger space and surface beaten zones are concerned (Figure 2). Although the cones of fire for precision rifles are much smaller than machine guns, they exist all the same. You can see below how the group would get larger as the target becomes further away.
While some people have to think of their rifles as “laser beams” for them to trust their equipment, I think it’s important to understand the true functioning of the rifle system, not only for distinguishing between fact and fiction on target, but also for people that need to understand their effective range to a high degree of certainty (hunters, etc.).

The normal distributions for dispersion happen simultaneously in the x and y-axis on target, hence why large sample size groups show a tendency towards being circular. From the distribution of shots on target, the standard deviation can be ascertained. In the case of groups, radial standard deviation—which can be seen in Equation 1—can be used to simplify the group’s variation to a single number instead of decoupling the x and y-axis. By finding the radial standard deviation, a probability field can be applied to the target.
sqrt(sigma_x^2 + sigma_y^2)Equation 1: Radial Standard Deviation
Assuming that the center of the group is centered on the point of aim, i.e. a rifle with good accuracy, applying a circle to the target with a radius of 3 SD should provide a decent estimate of the area in which you’d expect 99.7% of shots from that rifle to impact.
Radial SD is a little intensive to calculate unless you use an app that calculates it for you. A simpler method is to take the mean radius of the group, which is more common to find in group measuring apps, and multiply by 2.1. This will give you the 95% radius, the area in which 95% of your shots will fall. Both of these will get you closer to the expected overall precision of your rifle system.
I highly recommend using some kind of software to measure your groups if you intend to do any kind of statistical analysis on your own. Hand measuring methods to obtain mean radius or standard deviation are tedious at best.
One issue that can exist with these measuring methods is that of small groups. Since each shot has to be individually measured or marked, if your rifle is precise enough and you end up with one ragged hole, that can be difficult. The solution? Back up a little bit. Shoot groups at 200 or 300 yards so that each hole is readily identifiable. Of course, this may add in a little bit of environmental error, so be sure to take that into consideration when measuring your groups. Another solution would be to shoot 1 shot per bullseye, then using the many different software tools, like OnTarget TDS, to aggregate the groups for you if you are limited to 100 yards.
Putting It All Together
So why’s this all matter? Why have I been droning on about statistics and how to measure groups for the last three pages? Because without any understanding of it, people fall victim to the classic blunders of small sample sizes and misinterpreting what their targets show. Because without any way to tell what’s noise and what’s significant, people will tell you that the 0.5 MOA group and the 0.6 MOA group in your seating depth test are from different populations. That you should choose one powder charge over another because the one group you shot was worse. That because you’re 50 fps too fast it’s putting your barrel in a weird place on the x-y plane and it’ll shoot better if you slow your load down.
Reloading All Day has always been about telling people the reality behind internal ballistics, and demonstrating consistency in testing and analysis. We invite everyone to verify our testing for themselves, but people need to understand how to test and measure in a reliable, repeatable, and rigorous way if they’re to go about doing science correctly.
How do we test correctly?
To put it simply: shoot more. Three and five shot groups are not giving anyone enough information to make a determination if anything is better or worse. Even ten shots is asking a lot from a small sample. For statistically significant sample sizes, the minimum recommendation is 30 shots with more always being better.
That’s a lot of ammo.
Yes. RAD frequently does 100 and 200 round tests on everything from powder choice to seating depths to proving that our loads are as consistent as we say they are. It’s an incredible amount of powder to burn. That’s the cost of science. If you need to prove to yourself what we’re teaching, we have to recommend a sample size that is statistically significant. That’s how you get good, repeatable data.

When applied to common load development methods, testing 30 shots per seating depth or charge weight is incredibly inefficient. 30 shots across five powder charges and then across five seating depths is already 300 rounds of ammo. It’s more than what a lot of people shoot in a year. It’s a good portion of barrel life with magnums. Fortunately, the methods surrounding load development and internal ballistics have been pretty settled by ballisticians over the years and by taking one of our Advanced Reloading or 1-on-1 Courses, we can teach you the method to find exactly where you should load for the most consistent and precise ammo that you can shoot through your rifle.
Until then, take your rifle to the range and the next time you think that one seating depth may be better than another, consider shooting another group or two of each and see if your results are consistent.
Photo Credits
Figure 1: By Ainali - Own work, CC BY-SA 3.0, https://commons.wikimedia.org/w/index.php?curid=3141713
Figure 2: United States Department of the Army, FM 21-75, Appendix G
About the Author
Peyton is a new contributor to Reloading All Day. With a background in mathematics and engineering, Peyton has always been looking for ways to pursue his passions of reloading and long range shooting in a professional manner.
Growing up on a farm in southeast Missouri, the rifle was always a tool for dispatching predator and prey alike. The search for precision began here, at an early age.
With the tools and resources that Reloading All Day can bring to the table, he will to continue to pursue the testing of hypothesis on what makes rifles precise and delivering that information to reloaders and shooters through his writing.
The DPC Awards celebrate bizzo casino no deposit bonus the outstanding achievements in the digital marketing and creative industries, recognizing those who push the boundaries of innovation and excellence. With a diverse range of categories, the awards honor talent from various sectors, showcasing the best campaigns and strategies that drive engagement and results. It's a fantastic platform for professionals to gain recognition for their hard work and creativity while inspiring others in the field. The event fosters a sense of community, encouraging collaboration and sharing of ideas among industry leaders. Overall, the DPC Awards are a true testament to the power of creativity in the digital landscape.
Bitlife is a free mobile game in which you can experience life through the eyes of a randomly created character.